|
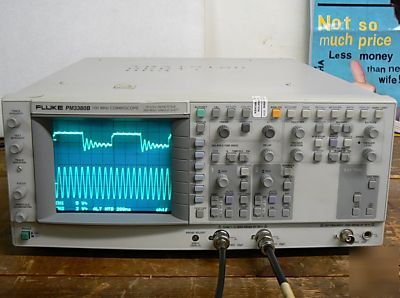
The Fluke PM3380B-933 oscilloscope is a graph-displaying device – it draws a graph of an electrical signal. In most applications, the graph shows how signals change over time: the vertical (Y) axis represents voltage and the horizontal (X) axis represents time. The intensity or brightness of the display is sometimes called the Z axis. The Fluke PM3380B-933 oscilloscope's simple graph can tell you many things about a signal, such as: the time and voltage values of a signal, the frequency of an oscillating signal, the “moving parts†of a circuit represented by the signal, the frequency with which a particular portion of the signal is occurring relative to, other portions, whether or not a malfunctioning component is distorting the signal, how much of a signal is direct current (DC) or alternating current (AC) and how much of the signal is noise and whether the noise is changing with time. Performance Characteristics of the PM3380B-933 Simultaneous Maximum Sampling Rate/ch One ch. only max. sampling rate Maximum Input#2 (for Impedance #2) Programmability/Connectivity of the PM3380B-933 PM3380B-933 Power Requirements Universal (Auto Sense and Switch) PM3380B-933 Physical Dimensions Click on thumbnails above for big pictures! Get Skype and contact me directly when we're both online! The free listing tool. List your items fast and easy and manage your active items. (please look at our rules and privacy policy) |
a.paul@modularparts.com (Angelita Paul) for more information. This email will be sent to Angelita Paul' actual email address.